
The Database Inspector lets you inspect, query, and modify your app's databases while your app is running. This is especially useful for database debugging. The Database Inspector works with plain SQLite and with libraries built on top of SQLite, such as Room.
Open the Database Inspector
To open a database in the Database Inspector, do the following:
Run your app on an emulator or connected device running API level 26 or higher.
From the menu bar, select View > Tool Windows > App Inspection.
Select the Database Inspector tab.
Select the running app process from the menu.
The databases in the currently running app appear in the Databases pane. Expand the node for the database that you want to inspect.
View and modify data
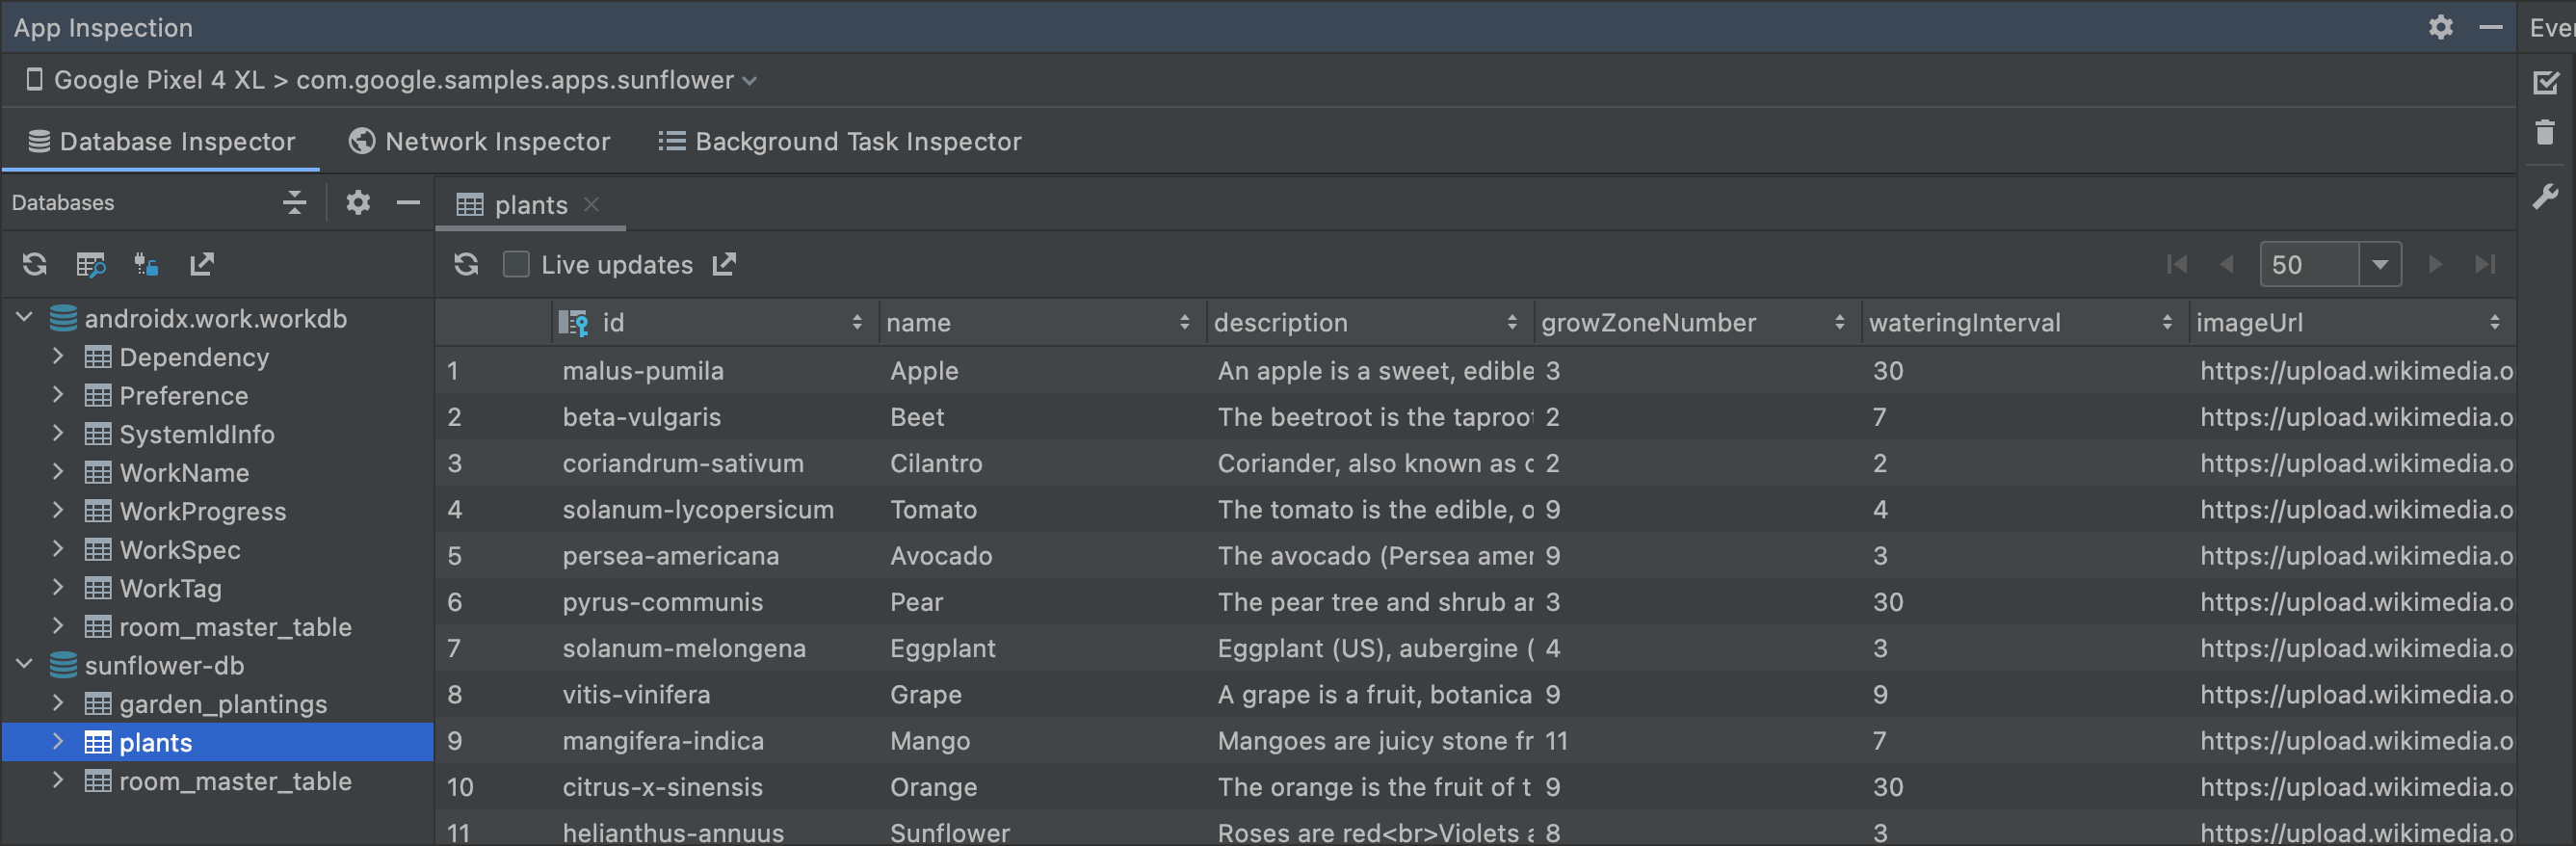
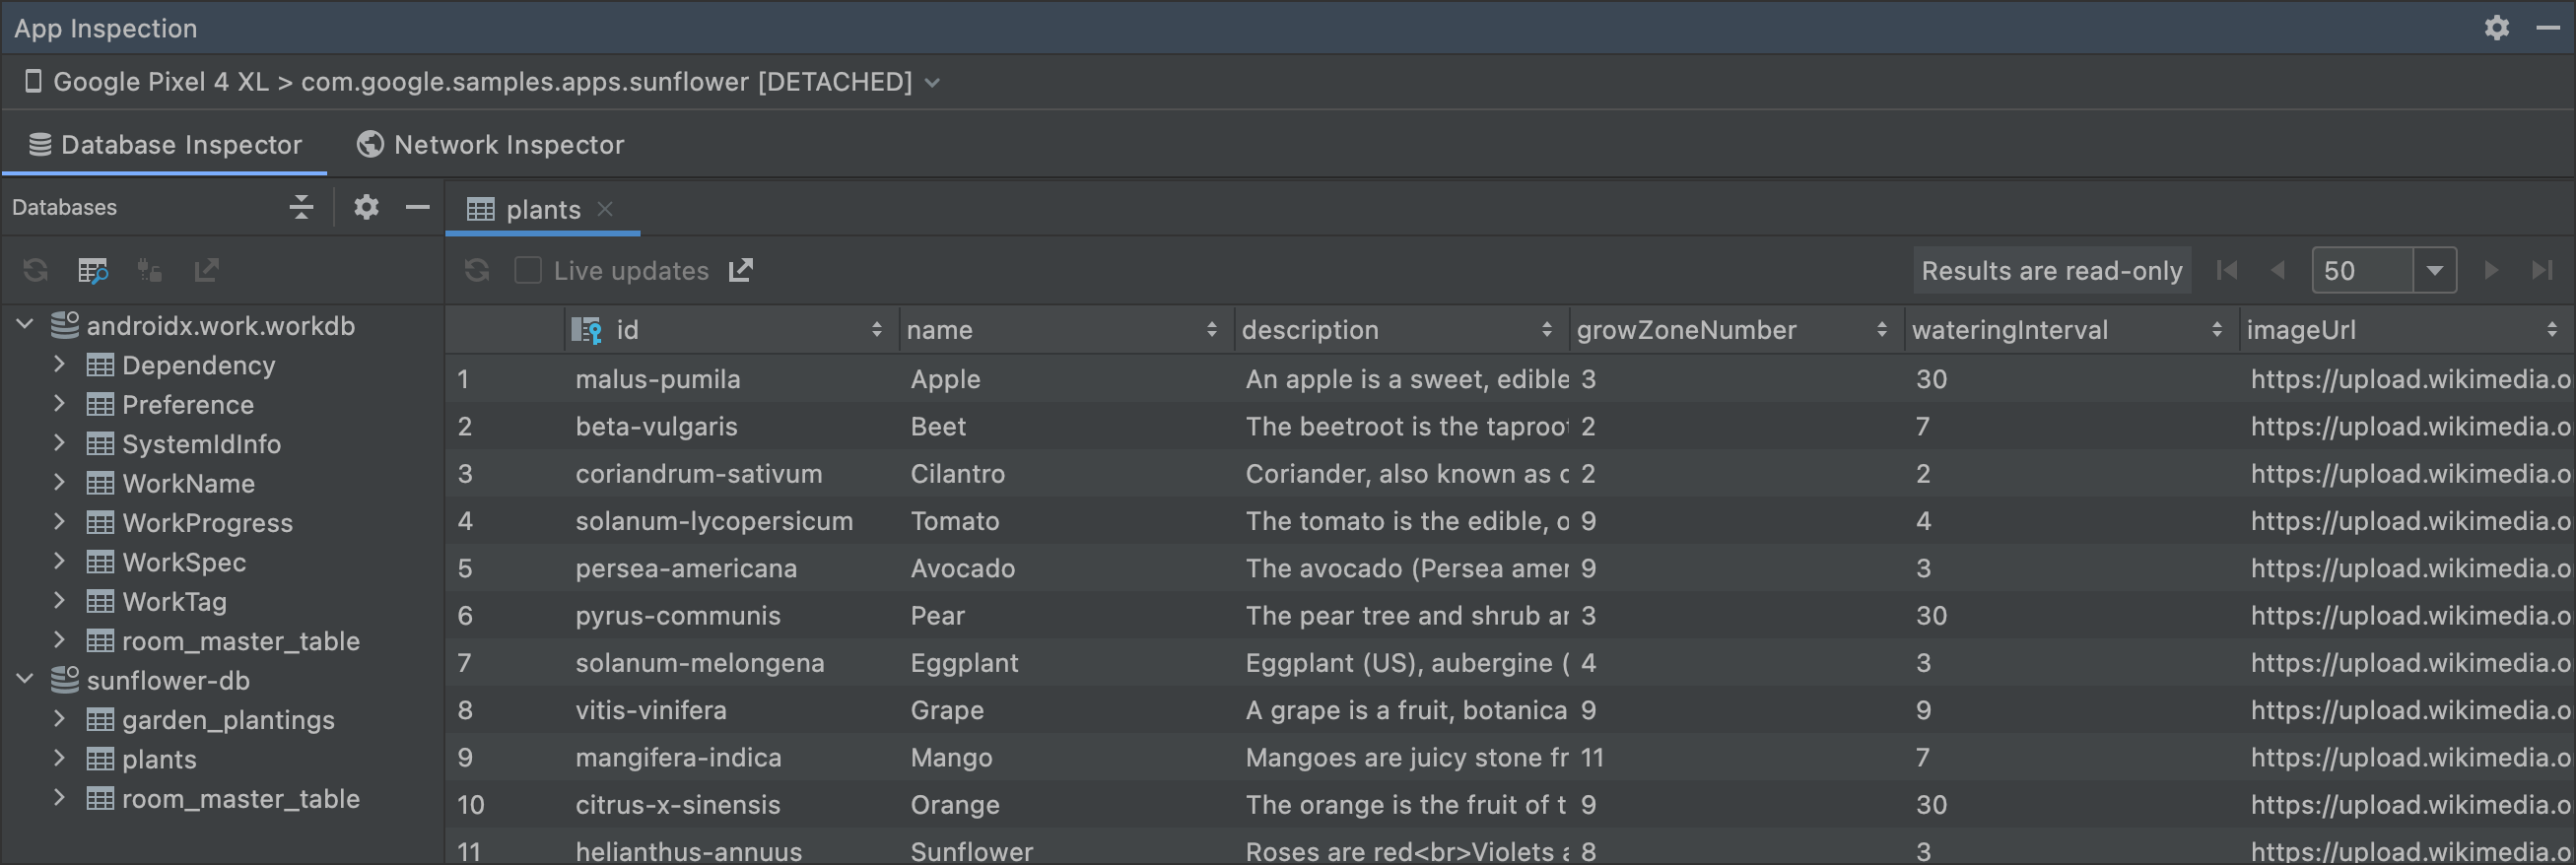
The Databases pane displays a list of the databases in your app and the tables that each database contains. Double-click a table name to display its data in the inspector window to the right, shown in figure 1. Click a column header to sort the data in the inspector window by that column.
To modify data in a table, follow these steps:
- Double-click a cell.
- Type a new value.
- Press Enter.
If your app uses Room and your UI observes the database, such as with LiveData
or Flow, then any changes you make to the data are
immediately visible in your running app. Otherwise, changes are only visible the
next time your app reads the modified data from the database.
See live database changes
If you want the Database Inspector to automatically update the data it presents as you interact with your running app, select the Live updates checkbox at the top of the inspector window. While live updates are enabled, the table in the inspector window is read-only and you can't modify its values.
Alternatively, to manually update the data, click the Refresh table button at the top of the inspector window.
Query your databases
The Database Inspector can run queries against your app's database while the app is running. The tool can use DAO queries if your app uses Room, but it also supports custom SQL queries.
Run DAO queries
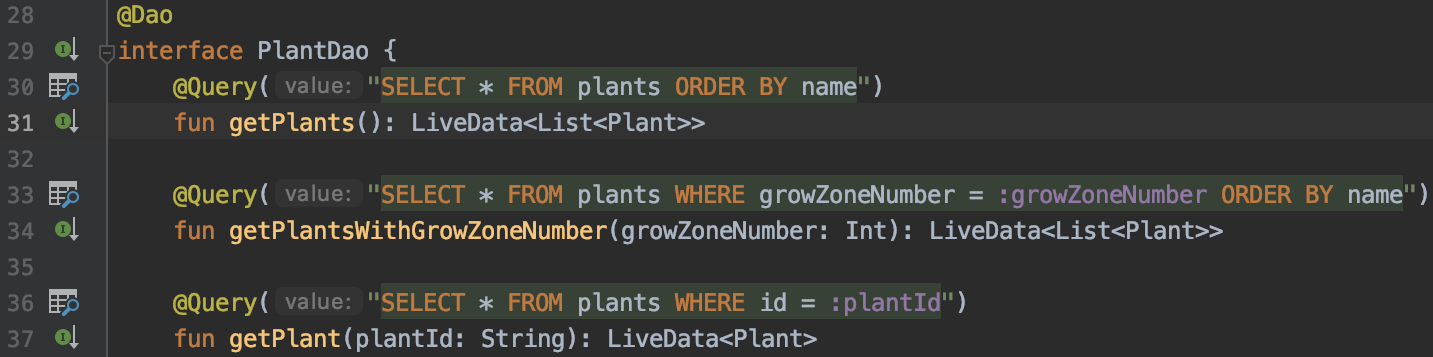
If your app uses Room, Android Studio provides gutter actions that let you quickly run query methods that you have already defined in your DAO classes. These actions are available while your app is running and the Database Inspector is open in the IDE.
To run any query method in a DAO, click the Run SQLite
statement in Database Inspector
 button next to its
 @Query annotation.
If your app includes more than one database, Android Studio prompts you to select the database to query against from a list. If your query method includes named bind parameters, Android Studio requests values for each parameter before running the query. The query results are displayed in the inspector window.
Run custom SQL queries
You can also use the Database Inspector to run custom SQL queries against your app's databases while your app is running.
To query a database, follow these steps:
Click Open New Query tab
at the top of the Databases pane to open a new tab
in the inspector window.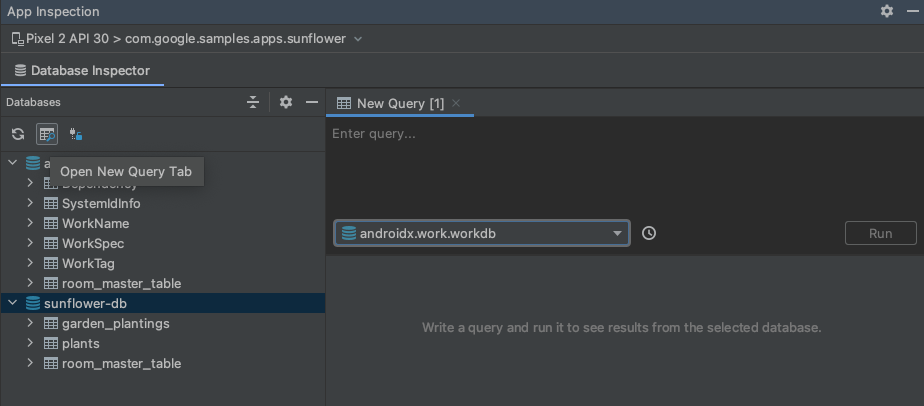
Figure 3. Open a New Query tab. If your app includes more than one database, select the database to query from the list on the New Query tab.
At the top of the New Query tab, type your custom SQL query into the text field.
Click Run.
Alternatively, use the query history feature to run a query that you used previously:
Click the Show query history
 button to see a list of queries that you previously ran against the selected
database.
button to see a list of queries that you previously ran against the selected
database.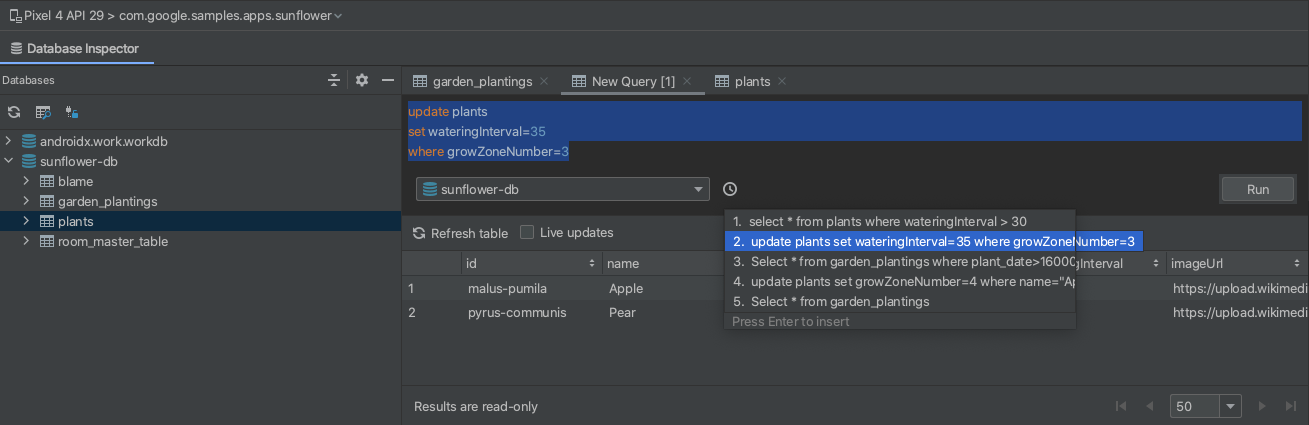
Figure 4. The query history menu. Click a query in the list to see a preview of the full query in the editor, and press Enter to copy it to the editor.
Click Run to execute the statement.
The query results that are displayed in the New Query tab are read-only and
can't be modified. However, you can use the custom SQL query field to run
modifier statements such as UPDATE, INSERT, or DELETE.
If your app uses
Room and your UI observes the database, such as with LiveData or Flow, then
any changes you make to the data are immediately visible in your running app.
Otherwise, changes are only visible the next time your app reads the modified
data from the database.
Offline mode
In Android Studio 4.2 and higher, you can continue to inspect your app's databases after a process disconnects. This makes it easier to debug your app after a crash.
When a disconnect occurs, the Database Inspector downloads your databases and makes them available to you in offline mode. When offline, you can still open tables and run queries.
When you reconnect to a live app process, the Database Inspector leaves offline mode and shows you only the data that is on the device. In other words, data shown in offline mode does not persist when you reconnect to an app process. Because of this limitation, the Database Inspector doesn't let you edit data or run modification SQL statements while in offline mode.
When you are viewing a database in offline mode, the process name includes
[DETACHED] to indicate that the inspector is no longer attached to the
process. Also, the database icon  indicates the offline state, shown in figure 5.
Keep database connections open
The Database Inspector can modify a database only while your app maintains a
live connection to that database. That means that if your app frequently
connects to and disconnects from databases, it can be difficult to debug those
databases. The Databases pane uses icons to identify open
 and closed
 databases.
Additionally, to prevent database connections from closing, toggle
Keep database connections open from off
 to on
to on
 at the top of the Databases pane.
Export data from the Database Inspector
You can export databases, tables, and query results from the Database Inspector to save, share, or re-create locally. When you open up an app project in Android Studio and inspect the app for that project in the Database Inspector, you can start exporting data in one of the following ways:
- Select a database or table in the Databases panel and click Export to file near the top of the panel.
- Right-click a database or table in the Databases panel and select Export to file from the context menu.
- When inspecting a table or query results in a tab, click Export to file above the table or query results.
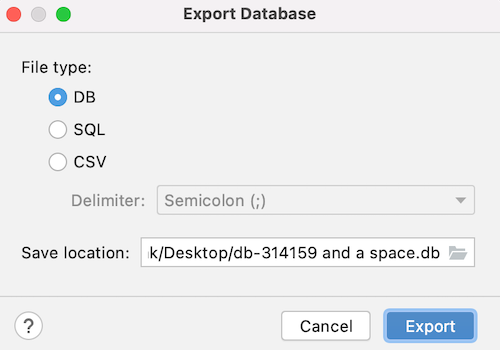
After selecting an export action, use the Export Database dialog to help you through the final steps, as shown in figure 6.
Depending on whether you are trying to export a database, table, or query results, you have the option of exporting the data in one or more of the following formats: DB, SQL, or CSV.
Additional resources
To learn more about the Database Inspector, see the following additional resources: