
This document shows best practices to help diagnose problems and ensure your Baseline Profiles work correctly to provide the most benefit.
Build issues
If you have copied the Baseline Profiles example in the Now in Android sample app, you might encounter test failures during the Baseline Profile task stating that the tests cannot be run on an emulator:
./gradlew assembleDemoRelease
Starting a Gradle Daemon (subsequent builds will be faster)
Calculating task graph as no configuration cache is available for tasks: assembleDemoRelease
Type-safe project accessors is an incubating feature.

> Task :benchmarks:pixel6Api33DemoNonMinifiedReleaseAndroidTest
Starting 14 tests on pixel6Api33

com.google.samples.apps.nowinandroid.foryou.ScrollForYouFeedBenchmark > scrollFeedCompilationNone[pixel6Api33] FAILED
        java.lang.AssertionError: ERRORS (not suppressed): EMULATOR
        WARNINGS (suppressed):
        ...
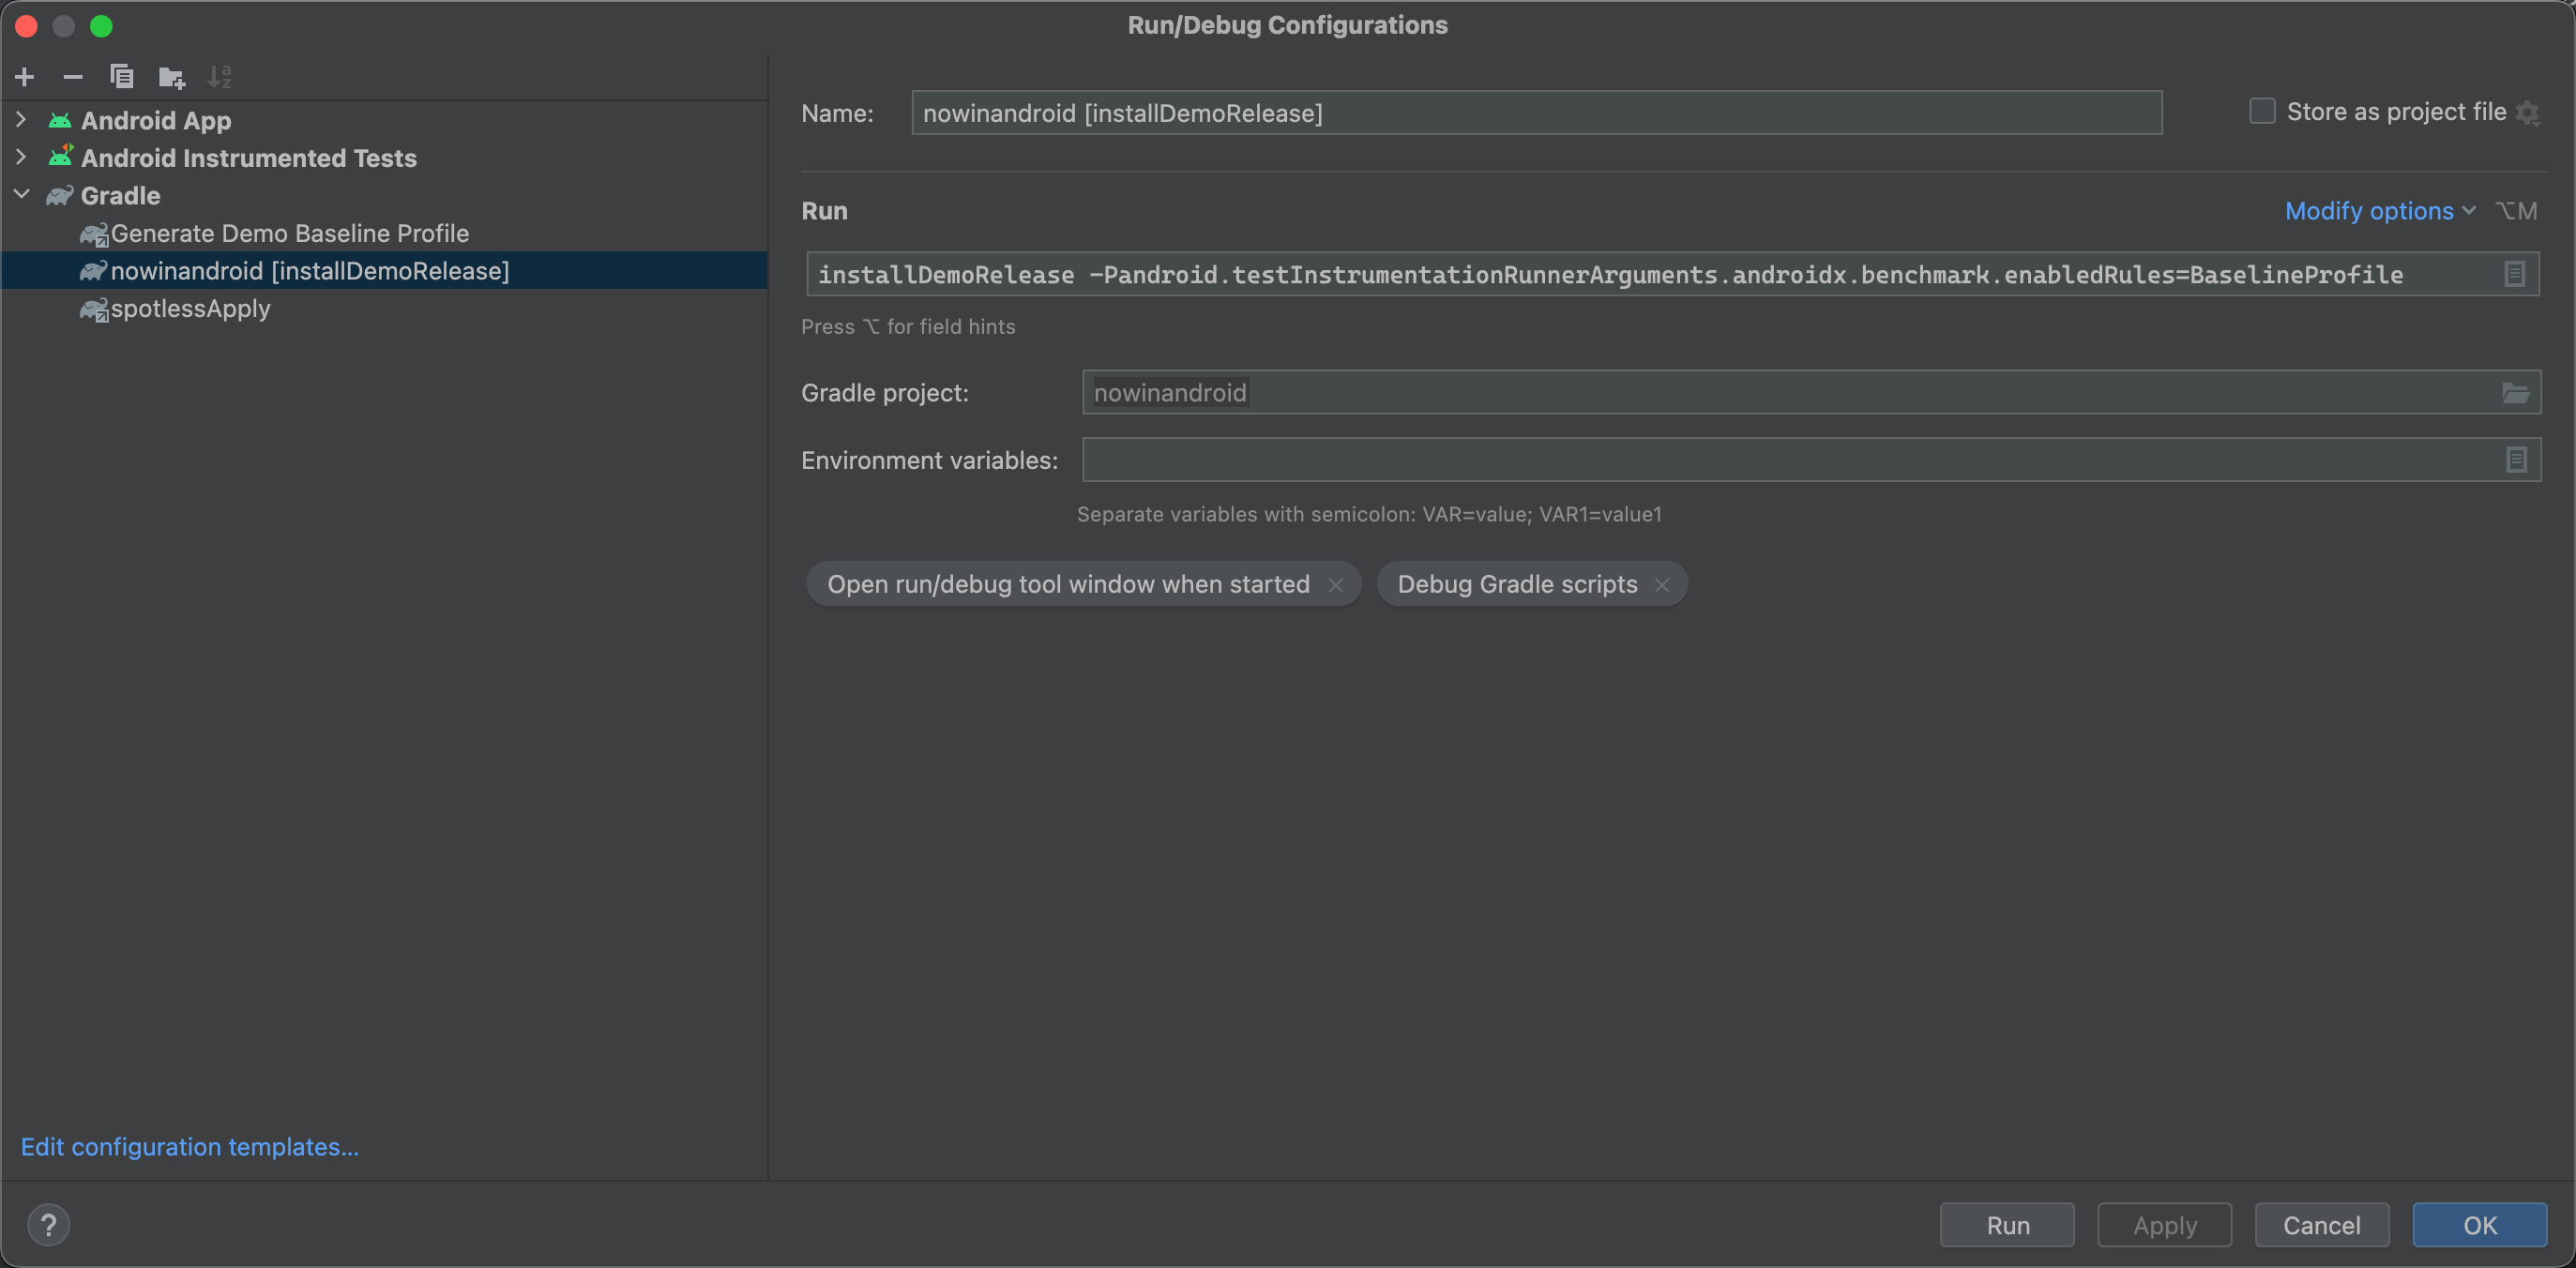
The failures occur because Now in Android uses a Gradle-managed device for Baseline Profile generation. The failures are expected, because you generally shouldn't run performance benchmarks on an emulator. However, since you're not collecting performance metrics when you generate Baseline Profiles, you can run Baseline Profile collection on emulators for convenience. To use Baseline Profiles with an emulator, perform the build and installation from the command-line, and set an argument to enable Baseline Profiles rules:
installDemoRelease -Pandroid.testInstrumentationRunnerArguments.androidx.benchmark.enabledRules=BaselineProfile
Alternatively, you can create a custom run configuration in Android Studio to enable Baseline Profiles on emulators by selecting Run > Edit Configurations:
Installation issues
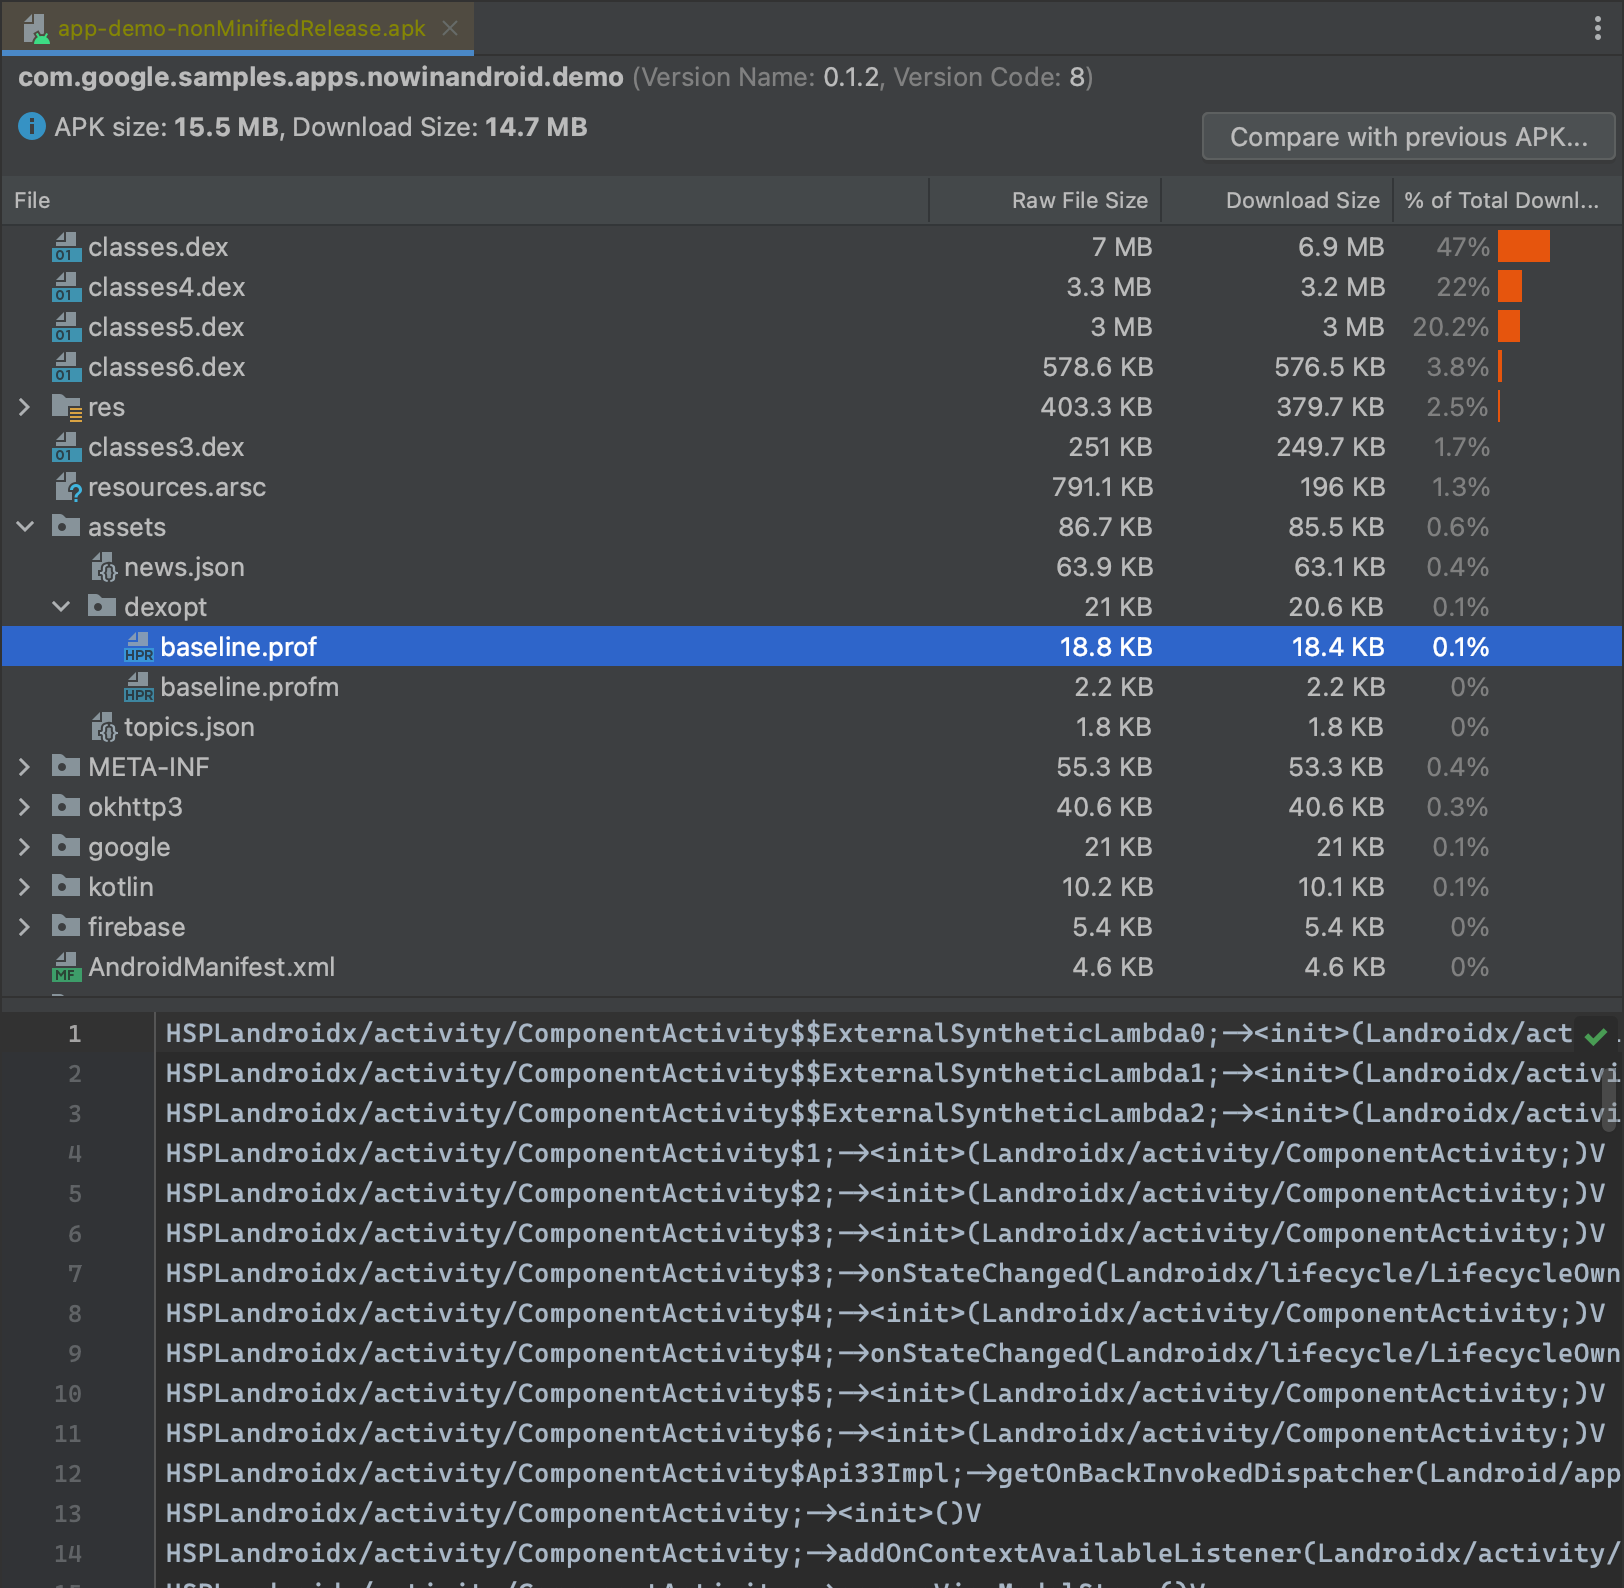
Check that the APK or AAB you're building is from a build variant that includes
Baseline Profiles. The easiest way to check this is by opening the APK in
Android Studio by selecting Build > Analyze APK, opening your
APK, and looking for the profile in the /assets/dexopt/baseline.prof
file:
Baseline Profiles need to be compiled on the device running the app. For both
app store installs and apps installed using
PackageInstaller, the on-device compilation happens as part of the app
install process. However, when the app is sideloaded from Android Studio, or
using command-line tools, the Jetpack ProfileInstaller library is
responsible for enqueueing the profiles for compilation during the next
background DEX optimization process. In those cases, if you want to ensure your
Baseline Profiles are being used, you might need to
force compilation of Baseline Profiles. ProfileVerifier lets
you query the status of the profile installation and compilation, as shown in
the following example:
Kotlin
private const val TAG = "MainActivity"

class MainActivity : ComponentActivity() {
  ...
  override fun onResume() {
    super.onResume()
    lifecycleScope.launch {
      logCompilationStatus()
    }
  }

  private suspend fun logCompilationStatus() {
     withContext(Dispatchers.IO) {
        val status = ProfileVerifier.getCompilationStatusAsync().await()
        when (status.profileInstallResultCode) {
            RESULT_CODE_NO_PROFILE ->
                Log.d(TAG, "ProfileInstaller: Baseline Profile not found")
            RESULT_CODE_COMPILED_WITH_PROFILE ->
                Log.d(TAG, "ProfileInstaller: Compiled with profile")
            RESULT_CODE_PROFILE_ENQUEUED_FOR_COMPILATION ->
                Log.d(TAG, "ProfileInstaller: Enqueued for compilation")
            RESULT_CODE_COMPILED_WITH_PROFILE_NON_MATCHING ->
                Log.d(TAG, "ProfileInstaller: App was installed through Play store")
            RESULT_CODE_ERROR_PACKAGE_NAME_DOES_NOT_EXIST ->
                Log.d(TAG, "ProfileInstaller: PackageName not found")
            RESULT_CODE_ERROR_CACHE_FILE_EXISTS_BUT_CANNOT_BE_READ ->
                Log.d(TAG, "ProfileInstaller: Cache file exists but cannot be read")
            RESULT_CODE_ERROR_CANT_WRITE_PROFILE_VERIFICATION_RESULT_CACHE_FILE ->
                Log.d(TAG, "ProfileInstaller: Can't write cache file")
            RESULT_CODE_ERROR_UNSUPPORTED_API_VERSION ->
                Log.d(TAG, "ProfileInstaller: Enqueued for compilation")
            else ->
                Log.d(TAG, "ProfileInstaller: Profile not compiled or enqueued")
        }
    }
}
Java
public class MainActivity extends ComponentActivity {

    private static final String TAG = "MainActivity";

    @Override
    protected void onResume() {
        super.onResume();

        logCompilationStatus();
    }

    private void logCompilationStatus() {
         ListeningExecutorService service = MoreExecutors.listeningDecorator(
                Executors.newSingleThreadExecutor());
        ListenableFuture<ProfileVerifier.CompilationStatus> future =
                ProfileVerifier.getCompilationStatusAsync();
        Futures.addCallback(future, new FutureCallback<>() {
            @Override
            public void onSuccess(CompilationStatus result) {
                int resultCode = result.getProfileInstallResultCode();
                if (resultCode == RESULT_CODE_NO_PROFILE) {
                    Log.d(TAG, "ProfileInstaller: Baseline Profile not found");
                } else if (resultCode == RESULT_CODE_COMPILED_WITH_PROFILE) {
                    Log.d(TAG, "ProfileInstaller: Compiled with profile");
                } else if (resultCode == RESULT_CODE_PROFILE_ENQUEUED_FOR_COMPILATION) {
                    Log.d(TAG, "ProfileInstaller: Enqueued for compilation");
                } else if (resultCode == RESULT_CODE_COMPILED_WITH_PROFILE_NON_MATCHING) {
                    Log.d(TAG, "ProfileInstaller: App was installed through Play store");
                } else if (resultCode == RESULT_CODE_ERROR_PACKAGE_NAME_DOES_NOT_EXIST) {
                    Log.d(TAG, "ProfileInstaller: PackageName not found");
                } else if (resultCode == RESULT_CODE_ERROR_CACHE_FILE_EXISTS_BUT_CANNOT_BE_READ) {
                    Log.d(TAG, "ProfileInstaller: Cache file exists but cannot be read");
                } else if (resultCode
                        == RESULT_CODE_ERROR_CANT_WRITE_PROFILE_VERIFICATION_RESULT_CACHE_FILE) {
                    Log.d(TAG, "ProfileInstaller: Can't write cache file");
                } else if (resultCode == RESULT_CODE_ERROR_UNSUPPORTED_API_VERSION) {
                    Log.d(TAG, "ProfileInstaller: Enqueued for compilation");
                } else {
                    Log.d(TAG, "ProfileInstaller: Profile not compiled or enqueued");
                }
            }

            @Override
            public void onFailure(Throwable t) {
                Log.d(TAG,
                        "ProfileInstaller: Error getting installation status: " + t.getMessage());
            }
        }, service);
    }
}
The following result codes provide hints for the cause of some issues:
RESULT_CODE_COMPILED_WITH_PROFILE- The profile is installed, compiled, and is used whenever the app is run. This is the result you want to see.
RESULT_CODE_ERROR_NO_PROFILE_EMBEDDED- No profile is found in the APK or AAB being run. Ensure that you're using a build variant that includes Baseline Profiles if you see this error, and that the APK contains a profile.
RESULT_CODE_NO_PROFILE- No profile was installed for this app when installing the app through app
store or package manager. The main reason for this to error code is that profile
installer did not run due to
ProfileInstallerInitializerbeing disabled. Note that when this error is reported an embedded profile was still found in the application APK. When an embedded profile is not found, the error code returned isRESULT_CODE_ERROR_NO_PROFILE_EMBEDDED. RESULT_CODE_PROFILE_ENQUEUED_FOR_COMPILATION- A profile is found in the APK or AAB and is enqueued for compilation. When a
profile is installed by
ProfileInstaller, it is queued for compilation the next time background DEX optimization is run by the system. The profile isn't active until compilation completes. Don't attempt to benchmark your Baseline Profiles until compilation is complete. You might need to force compilation of Baseline Profiles. This error won't occur when app is installed from the app store or package manager on devices running Android 9 (API 28) and higher, because compilation is performed during installation. RESULT_CODE_COMPILED_WITH_PROFILE_NON_MATCHING- A non-matching profile is installed and the app has been compiled with it.
This is the result of installation through Google Play store or package manager.
Note that this result differs from
RESULT_CODE_COMPILED_WITH_PROFILEbecause the non-matching profile will only compile any methods that are still shared between the profile and the app. The profile is effectively smaller than expected, and fewer methods will be compiled than were included in the Baseline Profile. RESULT_CODE_ERROR_CANT_WRITE_PROFILE_VERIFICATION_RESULT_CACHE_FILEProfileVerifiercan't write the verification result cache file. This can either happen because something is wrong with the app folder permissions or if there isn't enough free disk space on the device.RESULT_CODE_ERROR_UNSUPPORTED_API_VERSION- ProfileVerifier
is running on an unsupported API version of Android.
ProfileVerifier
supports only Android 9 (API level 28) and higher. RESULT_CODE_ERROR_PACKAGE_NAME_DOES_NOT_EXIST- A
PackageManager.NameNotFoundExceptionis thrown when querying thePackageManagerfor the app package. This should rarely happen. Try uninstalling the app and reinstalling everything. RESULT_CODE_ERROR_CACHE_FILE_EXISTS_BUT_CANNOT_BE_READ- A previous verification result cache file exists, but it can't be read. This should rarely happen. Try uninstalling the app and reinstalling everything.
Use ProfileVerifier in production
In production, you can use ProfileVerifier in conjunction with
analytics-reporting libraries, such as Google Analytics for Firebase, to
generate analytics events indicating the profile status. For example, this
alerts you quickly if a new app version is released that doesn't contain
Baseline Profiles.
Force compilation of Baseline Profiles
If the compilation status of your Baseline Profiles is
RESULT_CODE_PROFILE_ENQUEUED_FOR_COMPILATION, you can force immediate
compilation using adb:
adb shell cmd package compile -r bg-dexopt PACKAGE_NAME
Check compilation state without ProfileVerifier
If you aren't using ProfileVerifier, you can check the compilation state using
adb, although it doesn't give as deep insights as ProfileVerifier:
adb shell dumpsys package dexopt | grep -A 2 PACKAGE_NAME
Using adb produces something similar to the following:
  [com.google.samples.apps.nowinandroid.demo]
    path: /data/app/~~dzJiGMKvp22vi2SsvfjkrQ==/com.google.samples.apps.nowinandroid.demo-7FR1sdJ8ZTy7eCLwAnn0Vg==/base.apk
      arm64: [status=speed-profile] [reason=bg-dexopt] [primary-abi]
        [location is /data/app/~~dzJiGMKvp22vi2SsvfjkrQ==/com.google.samples.apps.nowinandroid.demo-7FR1sdJ8ZTy7eCLwAnn0Vg==/oat/arm64/base.odex]
The status value indicates the profile compilation status and is one of the following values:
| Compilation status | Meaning |
|---|---|
speed‑profile |
A compiled profile exists and is being used. |
verify |
No compiled profile exists. |
A verify status doesn't mean that the APK or AAB doesn't contain a profile,
because it can be queued for compilation by the next background DEX optimization
task.
The reason value indicates what triggers the compilation of the profile and is one of the following values:
| Reason | Meaning |
|---|---|
install‑dm
|
A Baseline Profile was compiled manually or by Google Play when the app is installed. |
bg‑dexopt
|
A profile was compiled while your device was idle. This might be a Baseline Profile, or it might be a profile collected during app usage. |
cmdline
|
The compilation was triggered using adb. This might be a Baseline Profile, or it might be a profile collected during app usage. |
Performance issues
This section shows some best practices for correctly defining and benchmarking your Baseline Profiles to get the most benefits from them.
Correctly benchmark startup metrics
Your Baseline Profiles will be more effective if your startup metrics are well-defined. The two key metrics are time to initial display (TTID) and time to full display (TTFD).
TTID is when the app draws its first frame. It's important to keep this as short as possible because displaying something shows the user that the app is running. You can even display an indeterminate progress indicator to show that the app is responsive.
TTFD is when the app can actually be interacted with. It's important to keep this as short as possible to avoid user frustration. If you correctly signal TTFD, you're telling the system that the code that's run on the way to TTFD is part of app startup. The system is more likely to place this code in the profile as a result.
Keep both TTID and TTFD as low as possible to make your app feel responsive.
The system is able to detect TTID, display it in Logcat, and report it as part
of startup benchmarks. However, the system is unable to determine TTFD, and it's
the app's responsibility to report when it reaches a fully drawn interactive
state. You can do this by calling reportFullyDrawn(), or
ReportDrawn if you're using Jetpack Compose. If you have multiple
background tasks that all need to complete before the app is considered fully
drawn, then you can use FullyDrawnReporter, as described in Improve
startup timing accuracy.
Library profiles and custom profiles
When benchmarking the impact of profiles, it can be difficult to separate the benefits of your app's profiles from profiles contributed by libraries, such as Jetpack libraries. When you build your APK the Android Gradle plugin adds any profiles in library dependencies as well as your custom profile. This is good for optimizing overall performance, and is recommended for your release builds. However, it makes it hard to measure how much additional performance gain comes from your custom profile.
A quick way to manually see the additional optimization provided by your custom profile is to remove it, and run your benchmarks. Then replace it and run your benchmarks again. Comparing the two will show you the optimizations provided by the library profiles alone, and the library profiles plus your custom profile.
An automatable way of comparing profiles is by creating a new build variant that
contains only the library profiles and not your custom profile. Compare
benchmarks from this variant to the release variant that contains both the
library profiles and your custom profiles. The following example shows how
to set up the variant that includes only library profiles. Add a new variant
named releaseWithoutCustomProfile to your profile consumer module, which is
typically your app module:
Kotlin
android {
  ...
  buildTypes {
    ...
    // Release build with only library profiles.
    create("releaseWithoutCustomProfile") {
      initWith(release)
    }
    ...
  }
  ...
}
...
dependencies {
  ...
  // Remove the baselineProfile dependency.
  // baselineProfile(project(":baselineprofile"))
}

baselineProfile {
  variants {
    create("release") {
      from(project(":baselineprofile"))
    }
  }
}
Groovy
android {
  ...
  buildTypes {
    ...
    // Release build with only library profiles.
    releaseWithoutCustomProfile {
      initWith(release)
    }
    ...
  }
  ...
}
...
dependencies {
  ...
  // Remove the baselineProfile dependency.
  // baselineProfile ':baselineprofile"'
}

baselineProfile {
  variants {
    release {
      from(project(":baselineprofile"))
    }
  }
}
The preceding code example removes the baselineProfile dependency from all
variants and selectively applies it to only the release variant. It might seem
counterintuitive that the library profiles are still being added when the
dependency on the profile producer module is removed. However, this module is
only responsible for generating your custom profile. The Android Gradle
plugin is still running for all variants, and is responsible for including
library profiles.
You also need to add the new variant to the profile generator module. In this
example the producer module is named :baselineprofile.
Kotlin
android {
  ...
    buildTypes {
      ...
      // Release build with only library profiles.
      create("releaseWithoutCustomProfile") {}
      ...
    }
  ...
}
Groovy
android {
  ...
    buildTypes {
      ...
      // Release build with only library profiles.
      releaseWithoutCustomProfile {}
      ...
    }
  ...
}
To benchmark with only the library profiles, run the following:
./gradlew :baselineprofile:connectedBenchmarkReleaseWithoutCustomProfileAndroidTest
To benchmark with both the library profiles and your custom profile, run the following:
./gradlew :baselineprofile:connectedBenchmarkReleaseAndroidTest
Running the preceding code on the Macrobenchmark sample app shows there is
a performance difference between the two variants. With just the library
profiles, the warm startupCompose benchmark shows the following results:
SmallListStartupBenchmark_startupCompose[mode=COLD]
timeToInitialDisplayMs   min  70.8,   median  79.1,   max 126.0
Traces: Iteration 0 1 2 3 4 5 6 7 8 9
There are library profiles in many Jetpack Compose libraries, so there are some optimizations just by using the Baseline Profile Gradle plugin. However, there are additional optimizations when using the custom profile:
SmallListStartupBenchmark_startupCompose[mode=COLD]
timeToInitialDisplayMs   min 57.9,   median 73.5,   max 92.3
Traces: Iteration 0 1 2 3 4 5 6 7 8 9
Avoid I/O-bound app startup
If your app is performing a lot of I/O calls or networks calls during startup, it can negatively affect both app startup time and the accuracy of your startup benchmarking. These heavyweight calls can take indeterminate amounts of time that can vary over time and even between iterations of the same benchmark. I/O calls are generally better than network calls, because the latter can be affected by factors external to the device and on the device itself. Avoid network calls during startup. Where using one or other is unavoidable, use I/O.
We recommend making your app architecture support app startup without network or I/O calls, even if only to use it when benchmarking startup. This helps ensure the lowest possible variability between different iterations of your benchmarks.
If your app uses Hilt, you can provide fake I/O-bound implementations when benchmarking in Microbenchmark and Hilt.
Cover all important user journeys
It's important to accurately cover all of the important user journeys in your Baseline Profile generation. Any user journeys that aren't covered won't be improved by Baseline Profiles. The most effective baseline profiles include all common startup user journeys as well as performance-sensitive in-app user journeys such as scrolling lists.